Aliens to your UHPLC System
Aliens to your UHPLC System
TOSOH
Application n°a15l81a
How UHPLC and Bioseparation Fit Together
For the analysis of small molecules UHPLC systems have already made their way to routine labs. They have become as reliable as their brothers in analysis, the HPLC systems. Once thinking about acquiring a UHPLC system for the analysis of biomolecules, one might be afraid that this will trigger an avalanche of necessary purchases; especially the change from the HPLC column format to UHPLC columns. Hence, this leaves users wondering about system compatibility.
A UHPLC system is – besides tolerating application pressure exceeding 1000 bar – first of all a HPLC instrument optimized with regards to dead volume, injection performance and detector sampling rate. From that perspective, it should not only be possible, but even advantageous to use UHPLC instrumentation for existing bioseparation methods, initially developed with HPLC columns on conventional HPLC systems.
ANALYSIS OF PROTEIN CHARGE VARIANTS
Figure 1 provides a proof of principle to the chromatographer’s considerations. A monoclonal antibody and its charge variants were analyzed by cation exchange chromatography on a TSKgel SP-STAT column (4.6 mm ID x 10 cm L) featuring nonporous 7 µm particles. The same column, sample and method were used to verify the column-system compatibility for both systems. At a first glance, the chromatograms look quite similar. However, taking a closer look, the column evidently performs better in the UHPLC system than it does when connected to the HPLC system. The number of theoretical plates is 6 % higher for the UHPLC setup. The improvement is quite obvious when taking a look at the main peak. The peak width is smaller for the UHPLC chromatogram than for the HPLC chromatogram.
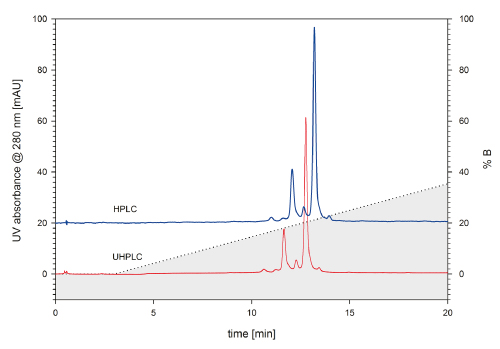
FIGURE 1_: A monoclonal IgG was analyzed using TSKgel SP-STAT 4.6 mm ID x 10 cm L. For analysis, a Dione x Ultimate 3000 HPLC system, equip - ped with a Dione x UVD 170S detector (blue ), and a Dione x Ultimate 3000RS UHPLC system (red), were used. Flow: 1 mL/min; Mobile Phase A: 10 mM sodium phosphate, pH 7.0; B: 10 mM sodium phosphate, pH 7.0 + 1 M sodium chloride ; Gradient 0-50 % B in 25 min; Detection UV @ 280 nm; Injection volume 5 μL each; Injected mass 5 μg
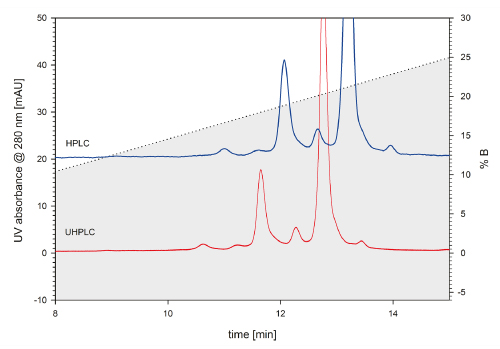
FIGURE 2_Zoo med elution profile of the mAb charge variants on TSKgel SP-STAT. The zoom provides better in sight into what extent the elution profile benefits from using a UHPLC system. The peak width is smaller for the UHPLC elution profile, compared to the HPLC chromatogram. Due to the decreased system dead volume, peak elution occurs earlier than for the HPLC system.
Gelfilt ration and UHPLC
Further proof on how “standard” HPLC columns can benefit from UHPLC systems is shown in figure 3. A standard protein mix is separated by TSKgel G2000SW XL. When connected to the UHPLC system, the number of theoretical plates exceeds 32000 for p-amino benzoic acid, while the column connected to a HPLC system reaches only 29000 theoretical plates for the same component. Another important parameter describing chromatographic performance is the resolution. For the HPLC data a resolution of 2.1 can be achieved for the separation of γ-globulin and ovalbumin and 10.2 for ribonuclease A and p-amino benzoic acid. For the UHPLC data the resolution factors increase to 2.2 and 10.9 for the respective peak pairs.
From these results, it can be concluded that HPLC columns indeed benefit from UHPLC systems. Generally, there’s no reason for not using HPLC columns in UHPLC systems. In the end, UHPLC and HPLC are still siblings of the same family of liquid chromatography. Compared to the impressive history of liquid chromatography, the possible pressure increase seems to be a minor landmark in a continuing story of technological progression. Bioseparation method transfer from HPLC to UHPLC is hardly more elaborate than from one HPLC instrument to another. In most cases, the applied pressure is far from exceeding the limit of a conventional HPLC system. This is due to the fact that many biological sample molecules themselves can’t stand too much pressure. In all the other aspects, a UHPLC system is nothing but a perfectly optimized HPLC system.

FIGURE 3_Standard protein mix consisting of thy roglobulin, γ-globulin , ovalbu min and ribonuclease A on TSKgel G2000SW XL (7.8 mm ID x 30 cm L). The standard further contains p-amino benzoic acid, which marks the inclusion volume of the column. The column was connected to a Dione x Ultimate 3000 RS UHPLC system (red chromatogram) and a Dione x Ultimate 3000 system (grey chromatogram), respectively. The number of theoretical plates for p-amino benzoic acid is increased by 10 % in the UHPLC data. Flow: 1 mL/min ; Mobile phase: 0.1 M sodium phosphate, pH 6.7 + 0.1 M sodium sulfate; Detection : UV @280 nm; Injection volume: 20 μL; Injected mass: ~40 μg
The best column for your UHPLC application
Having proved that a conventional HPLC column shows excellent performance in a UHPLC system should not discourage you from further improving the analysis. Using new column formats, perfectly adjusted to the new technical developments, it is possible to considerably shorten analysis time or further increase resolution. Figure 4 shows an example of what is possible with a short gel filtration column made of HPLC column hardware packed with 4 µm particles and a UHPLC. Depending on the resolution required, it is possible to shorten analysis time for the analysis of antibody aggregates from 15 minutes for a conventional 30 cm column with 5 µm particles down to 4 minutes when using a 15 cm column with 4 µm silica particles. The particle size is still large enough to keep the pressure in a moderate range, avoiding frictional heating inside the column, which might cause further aggregation or fragmentation during the analysis. These kinds of artifacts pretend a higher degree of impurities than actually existing within the sample vial.
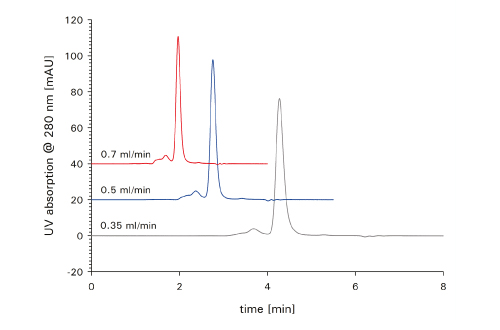
FIGURE 4_Aggregated mAb sample analyzed on TSKgel SuperSW mAb HTP (4.6 mm ID x 15 cm L) at three different flow rates (0.35 mL/min ; 0.5 mL/min and 0.7 mL/min ). Mobile phase: 0.1 M sodium phosphate, pH 6.7 + 0.1 M sodium sulfate; Detection: UV @ 280 nm; Injection volume: 5 μL
Small, smaller… sharper
Analytical chromatographers are always chasing for resolution and sharp peaks in order to optimize quantitation, but also to avoid that impurities hide under a sample peak. Further, peak symmetry and the number of theoretical plates achieved may serve as a hint for sample monodispersity, which is an important parameter related to product safety of a biopharmaceutical product. The monodispersity of a sample can also be investigated using static light scattering. Figure 5a) shows the elution profile of a monoclonal antibody on TSKgel G3000SW XL.
The monoclonal antibody has been stored for two years at 4 ° C. Two different integration ranges were set to determine the main peak polydispersity index (Fig. 5 b & c). The integration range including the peak tailing results in a polydispersity index of 1.007, versus 1.002 for the peak excluding the tailing. This suggests that the mAb undergoes slight degradation during long-term storage, and that the tail is not an artifact of column deterioration, but represents the actual sample composition.
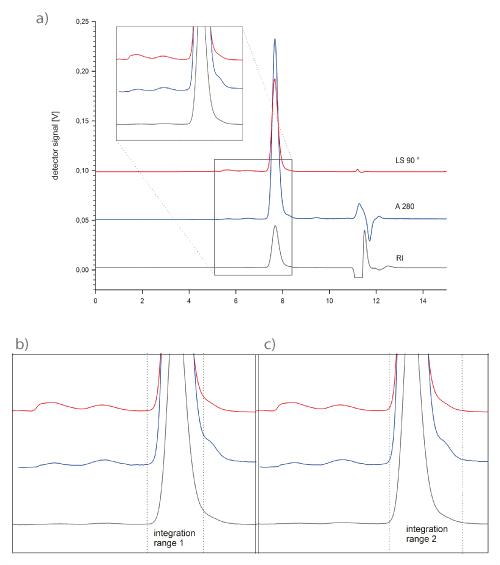
FIGURE 5_ a): The monodispersity of a monoclonal antibody was analyzed using static light scattering in order to assess its quality after 2 years of storage at 4 °C.
b) & c): zoomed sections of the main peak as indicated in the complete chromatogram. Two varying integration frames were applied for the monodispersity determination. Including the tail into the integration range results in a polydispersity inde x of 1.007, while the index is 1.002 for integration range 1. A TSKgel G3000 SW XL column was used. Flow: 1 mL/min;
Mobile phase: 0.1 M sodium phosphate, pH 6.7, 0.1 M sodium sulfate; Injection volume: 20 μL, Injected mass: 20 μg
Improve detector performance
Online static light scattering is actually a multi detector method relying on the light scattering signals and a concentration signal source. Typically, a RI detector is employed for the purpose of concentration measurement, as the dn/dc value correlating the signal with the concentration can be considered constant for proteins. In contrast, the extinction coefficient deviates much more from protein to protein. Hence, monodispersity analysis by online static light scattering is not quite robust when using solvent gradients.
In this case, a chromatographer has to rely on the separation performance. In other words, resolution must be high enough to ensure that one peak represents one molecular species. Besides column performance and the choice of an appropriate method, the instrumentation turns out to be crucial. A quite simple but effective improvement is to use optimized detector flow cells. Many instrument manufacturers offer different UV cell sizes.
A standard UHPLC flow cell of a common UHPLC system has a volume of up to 11 µL, whereas semi-micro flow cells feature volumes of 2 - 2.5 µL, which is in fact the same as it can be found in HPLC systems. Figure 6 shows a chromatogram that was detected with a standard 11 µL flow cell within a UHPLC system. The two standard proteins lysozyme and BSA are separated by a TSKgel C4-300 2 mm ID x 5 cm L. The two components can be resolved by a factor of 2.28. A significant increase in resolution between the two peaks could be achieved by applying the 2.5 µL detector flow cell to the same system and column, resulting in a resolution factor of 2.88 (Fig. 7).
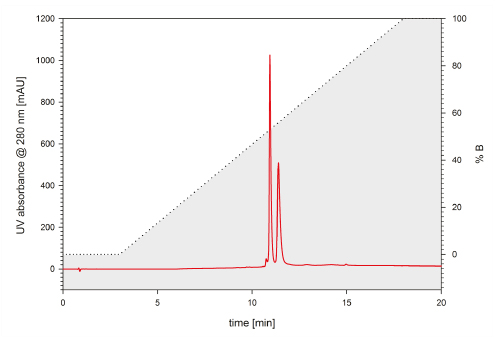
FIGURE 6_ Lysozyme from hen egg white and bovine serum albumin are separated on a TSKgel Protein C4-300 reversed phase column (2 mm ID x 5 cm L). The 3 µm particles offer resolution of the two proteins and a hydrophilic variant. The UHPLC UV detector was equipped with A 11 µL standard flow cell; Flow rate: 0.2 mL/min; Mobile phase A: 10/90/0.05 = ACN/H2 O/TFA, B: 80/20/0.05 = ACN/H2 O/TFA; Gradient: 0-100 % B in 15 min; Detection: UV @ 215 nm; Injection volume: 1 µL; Sample: BSA & lysozyme (1 µg/µL)
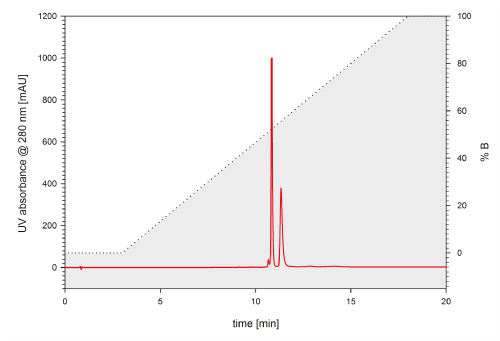
FIGURE 7_Exchanging the UV flow cell to a semi-micro 2.5 µl flow cell led to an increase in resolution of the two proteins by approximately 25 %. Flow rate: 0.2 mL/min; Mobile phase A: 10/90/0.05 = ACN/H2 O/TFA, B: 80/20/0.05 = ACN/H2 O/TFA; Gradien : 0-100 % B in 15 min; Detection: UV @ 215 nm; Injection volume: 1 µL; Sample: BSA & lysozyme (1 µg/µL)
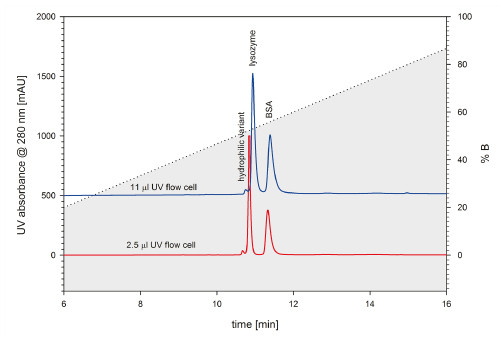
FIGURE 8_Zoomed comparison of the two chromatograms presented in Figure 6 and 7 with standard and semi-micro flow cells. Both chromatograms were ac qui red at the same UHPLC system. The semi-micro flow cell achieves far better resolution than the standard flow cell.
Technical evolution of HPLC
Besides the absolute cell volume, cell geometry also plays an important role. Instrument manufacturers have constantly been improving their cells. Comparing a HPLC system from the 1980s with a current HPLC system will lead to a far greater performance gap than the latter would suffer compared to a UHPLC system. Figure 9 provides a comparison of two different HPLC systems. 30 years of constant instrumentation improvement introduced an impressive performance gap.
The number of theoretical plates for p-amino benzoic acid is 30.500, when using the up-to-date HPLC system. For the HPLC system from the 1980s, this parameter reaches a number of 26.400, only. Further, when taking a look at the span of the separation range, it is obvious that the new instrumentation achieves better resolution.
From that perspective, a UHPLC system does not necessarily outclass an up-to-date HPLC system; it might be worth to put the actual focus on the optimization of the system, regardless whether you’re working with a HPLC system or a UHPLC system; with both systems TSKgel columns will continue to be the first choice for bioseparations, whether you apply gel filtration, ion exchange, HIC, HILIC or reversed phase mode.
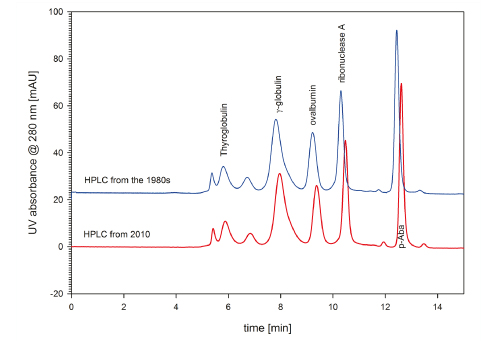
FIGURE 9_A TSKgel G3000SWXL (7.8 mm ID x 30 cm L) was used to compare instrument performance of a HPLC built in the 1980s and the performance of a system from 2010. The up-to-date HPLC system performs better, especially for the smaller sample components. Flow: 1 mL/min; Mobile pha se: 0.1 M sodium phosphate, pH 6.7 + 0.1 M sodium sulfate; Injection volume: 20 μL

TOSOH
Application n°a15l81a
How UHPLC and Bioseparation Fit Together
For the analysis of small molecules UHPLC systems have already made their way to routine labs. They have become as reliable as their brothers in analysis, the HPLC systems. Once thinking about acquiring a UHPLC system for the analysis of biomolecules, one might be afraid that this will trigger an avalanche of necessary purchases; especially the change from the HPLC column format to UHPLC columns. Hence, this leaves users wondering about system compatibility.
A UHPLC system is – besides tolerating application pressure exceeding 1000 bar – first of all a HPLC instrument optimized with regards to dead volume, injection performance and detector sampling rate. From that perspective, it should not only be possible, but even advantageous to use UHPLC instrumentation for existing bioseparation methods, initially developed with HPLC columns on conventional HPLC systems.
ANALYSIS OF PROTEIN CHARGE VARIANTS
Figure 1 provides a proof of principle to the chromatographer’s considerations. A monoclonal antibody and its charge variants were analyzed by cation exchange chromatography on a TSKgel SP-STAT column (4.6 mm ID x 10 cm L) featuring nonporous 7 µm particles. The same column, sample and method were used to verify the column-system compatibility for both systems. At a first glance, the chromatograms look quite similar. However, taking a closer look, the column evidently performs better in the UHPLC system than it does when connected to the HPLC system. The number of theoretical plates is 6 % higher for the UHPLC setup. The improvement is quite obvious when taking a look at the main peak. The peak width is smaller for the UHPLC chromatogram than for the HPLC chromatogram.
FIGURE 1_: A monoclonal IgG was analyzed using TSKgel SP-STAT 4.6 mm ID x 10 cm L. For analysis, a Dione x Ultimate 3000 HPLC system, equip - ped with a Dione x UVD 170S detector (blue ), and a Dione x Ultimate 3000RS UHPLC system (red), were used. Flow: 1 mL/min; Mobile Phase A: 10 mM sodium phosphate, pH 7.0; B: 10 mM sodium phosphate, pH 7.0 + 1 M sodium chloride ; Gradient 0-50 % B in 25 min; Detection UV @ 280 nm; Injection volume 5 μL each; Injected mass 5 μg
FIGURE 2_Zoo med elution profile of the mAb charge variants on TSKgel SP-STAT. The zoom provides better in sight into what extent the elution profile benefits from using a UHPLC system. The peak width is smaller for the UHPLC elution profile, compared to the HPLC chromatogram. Due to the decreased system dead volume, peak elution occurs earlier than for the HPLC system.
Gelfilt ration and UHPLC
Further proof on how “standard” HPLC columns can benefit from UHPLC systems is shown in figure 3. A standard protein mix is separated by TSKgel G2000SW XL. When connected to the UHPLC system, the number of theoretical plates exceeds 32000 for p-amino benzoic acid, while the column connected to a HPLC system reaches only 29000 theoretical plates for the same component. Another important parameter describing chromatographic performance is the resolution. For the HPLC data a resolution of 2.1 can be achieved for the separation of γ-globulin and ovalbumin and 10.2 for ribonuclease A and p-amino benzoic acid. For the UHPLC data the resolution factors increase to 2.2 and 10.9 for the respective peak pairs.
From these results, it can be concluded that HPLC columns indeed benefit from UHPLC systems. Generally, there’s no reason for not using HPLC columns in UHPLC systems. In the end, UHPLC and HPLC are still siblings of the same family of liquid chromatography. Compared to the impressive history of liquid chromatography, the possible pressure increase seems to be a minor landmark in a continuing story of technological progression. Bioseparation method transfer from HPLC to UHPLC is hardly more elaborate than from one HPLC instrument to another. In most cases, the applied pressure is far from exceeding the limit of a conventional HPLC system. This is due to the fact that many biological sample molecules themselves can’t stand too much pressure. In all the other aspects, a UHPLC system is nothing but a perfectly optimized HPLC system.
FIGURE 3_Standard protein mix consisting of thy roglobulin, γ-globulin , ovalbu min and ribonuclease A on TSKgel G2000SW XL (7.8 mm ID x 30 cm L). The standard further contains p-amino benzoic acid, which marks the inclusion volume of the column. The column was connected to a Dione x Ultimate 3000 RS UHPLC system (red chromatogram) and a Dione x Ultimate 3000 system (grey chromatogram), respectively. The number of theoretical plates for p-amino benzoic acid is increased by 10 % in the UHPLC data. Flow: 1 mL/min ; Mobile phase: 0.1 M sodium phosphate, pH 6.7 + 0.1 M sodium sulfate; Detection : UV @280 nm; Injection volume: 20 μL; Injected mass: ~40 μg
The best column for your UHPLC application
Having proved that a conventional HPLC column shows excellent performance in a UHPLC system should not discourage you from further improving the analysis. Using new column formats, perfectly adjusted to the new technical developments, it is possible to considerably shorten analysis time or further increase resolution. Figure 4 shows an example of what is possible with a short gel filtration column made of HPLC column hardware packed with 4 µm particles and a UHPLC. Depending on the resolution required, it is possible to shorten analysis time for the analysis of antibody aggregates from 15 minutes for a conventional 30 cm column with 5 µm particles down to 4 minutes when using a 15 cm column with 4 µm silica particles. The particle size is still large enough to keep the pressure in a moderate range, avoiding frictional heating inside the column, which might cause further aggregation or fragmentation during the analysis. These kinds of artifacts pretend a higher degree of impurities than actually existing within the sample vial.
FIGURE 4_Aggregated mAb sample analyzed on TSKgel SuperSW mAb HTP (4.6 mm ID x 15 cm L) at three different flow rates (0.35 mL/min ; 0.5 mL/min and 0.7 mL/min ). Mobile phase: 0.1 M sodium phosphate, pH 6.7 + 0.1 M sodium sulfate; Detection: UV @ 280 nm; Injection volume: 5 μL
Small, smaller… sharper
Analytical chromatographers are always chasing for resolution and sharp peaks in order to optimize quantitation, but also to avoid that impurities hide under a sample peak. Further, peak symmetry and the number of theoretical plates achieved may serve as a hint for sample monodispersity, which is an important parameter related to product safety of a biopharmaceutical product. The monodispersity of a sample can also be investigated using static light scattering. Figure 5a) shows the elution profile of a monoclonal antibody on TSKgel G3000SW XL.
The monoclonal antibody has been stored for two years at 4 ° C. Two different integration ranges were set to determine the main peak polydispersity index (Fig. 5 b & c). The integration range including the peak tailing results in a polydispersity index of 1.007, versus 1.002 for the peak excluding the tailing. This suggests that the mAb undergoes slight degradation during long-term storage, and that the tail is not an artifact of column deterioration, but represents the actual sample composition.
FIGURE 5_ a): The monodispersity of a monoclonal antibody was analyzed using static light scattering in order to assess its quality after 2 years of storage at 4 °C.
b) & c): zoomed sections of the main peak as indicated in the complete chromatogram. Two varying integration frames were applied for the monodispersity determination. Including the tail into the integration range results in a polydispersity inde x of 1.007, while the index is 1.002 for integration range 1. A TSKgel G3000 SW XL column was used. Flow: 1 mL/min;
Mobile phase: 0.1 M sodium phosphate, pH 6.7, 0.1 M sodium sulfate; Injection volume: 20 μL, Injected mass: 20 μg
Improve detector performance
Online static light scattering is actually a multi detector method relying on the light scattering signals and a concentration signal source. Typically, a RI detector is employed for the purpose of concentration measurement, as the dn/dc value correlating the signal with the concentration can be considered constant for proteins. In contrast, the extinction coefficient deviates much more from protein to protein. Hence, monodispersity analysis by online static light scattering is not quite robust when using solvent gradients.
In this case, a chromatographer has to rely on the separation performance. In other words, resolution must be high enough to ensure that one peak represents one molecular species. Besides column performance and the choice of an appropriate method, the instrumentation turns out to be crucial. A quite simple but effective improvement is to use optimized detector flow cells. Many instrument manufacturers offer different UV cell sizes.
A standard UHPLC flow cell of a common UHPLC system has a volume of up to 11 µL, whereas semi-micro flow cells feature volumes of 2 - 2.5 µL, which is in fact the same as it can be found in HPLC systems. Figure 6 shows a chromatogram that was detected with a standard 11 µL flow cell within a UHPLC system. The two standard proteins lysozyme and BSA are separated by a TSKgel C4-300 2 mm ID x 5 cm L. The two components can be resolved by a factor of 2.28. A significant increase in resolution between the two peaks could be achieved by applying the 2.5 µL detector flow cell to the same system and column, resulting in a resolution factor of 2.88 (Fig. 7).
FIGURE 6_ Lysozyme from hen egg white and bovine serum albumin are separated on a TSKgel Protein C4-300 reversed phase column (2 mm ID x 5 cm L). The 3 µm particles offer resolution of the two proteins and a hydrophilic variant. The UHPLC UV detector was equipped with A 11 µL standard flow cell; Flow rate: 0.2 mL/min; Mobile phase A: 10/90/0.05 = ACN/H2 O/TFA, B: 80/20/0.05 = ACN/H2 O/TFA; Gradient: 0-100 % B in 15 min; Detection: UV @ 215 nm; Injection volume: 1 µL; Sample: BSA & lysozyme (1 µg/µL)
FIGURE 7_Exchanging the UV flow cell to a semi-micro 2.5 µl flow cell led to an increase in resolution of the two proteins by approximately 25 %. Flow rate: 0.2 mL/min; Mobile phase A: 10/90/0.05 = ACN/H2 O/TFA, B: 80/20/0.05 = ACN/H2 O/TFA; Gradien : 0-100 % B in 15 min; Detection: UV @ 215 nm; Injection volume: 1 µL; Sample: BSA & lysozyme (1 µg/µL)
FIGURE 8_Zoomed comparison of the two chromatograms presented in Figure 6 and 7 with standard and semi-micro flow cells. Both chromatograms were ac qui red at the same UHPLC system. The semi-micro flow cell achieves far better resolution than the standard flow cell.
Technical evolution of HPLC
Besides the absolute cell volume, cell geometry also plays an important role. Instrument manufacturers have constantly been improving their cells. Comparing a HPLC system from the 1980s with a current HPLC system will lead to a far greater performance gap than the latter would suffer compared to a UHPLC system. Figure 9 provides a comparison of two different HPLC systems. 30 years of constant instrumentation improvement introduced an impressive performance gap.
The number of theoretical plates for p-amino benzoic acid is 30.500, when using the up-to-date HPLC system. For the HPLC system from the 1980s, this parameter reaches a number of 26.400, only. Further, when taking a look at the span of the separation range, it is obvious that the new instrumentation achieves better resolution.
From that perspective, a UHPLC system does not necessarily outclass an up-to-date HPLC system; it might be worth to put the actual focus on the optimization of the system, regardless whether you’re working with a HPLC system or a UHPLC system; with both systems TSKgel columns will continue to be the first choice for bioseparations, whether you apply gel filtration, ion exchange, HIC, HILIC or reversed phase mode.
FIGURE 9_A TSKgel G3000SWXL (7.8 mm ID x 30 cm L) was used to compare instrument performance of a HPLC built in the 1980s and the performance of a system from 2010. The up-to-date HPLC system performs better, especially for the smaller sample components. Flow: 1 mL/min; Mobile pha se: 0.1 M sodium phosphate, pH 6.7 + 0.1 M sodium sulfate; Injection volume: 20 μL
 Download_Application_a15l81a_Interchim1703.pdf
- (3.8 MiB) Downloaded 350 times