CHARACTERIZATION OF A NOVEL ANTIBODY
Characterization of a novel antibody
drug conjugate mimic by SEC and HIC
TOSOH
Application n°A17L35A
Introduction
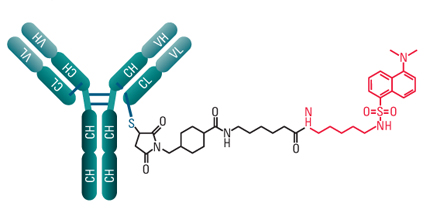
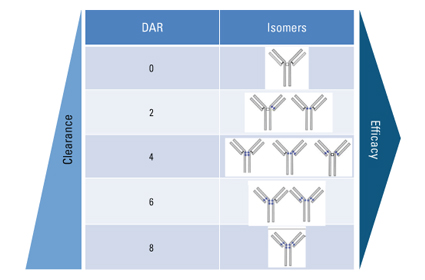
Empowered antibodies, such as antibody drug conjugates (ADCs), continue to be investigated as biotherapeutic drug candidates. ADCs combine the tumor specificity and targeting capability of mAbs with the cytotoxicity of potent small molecule drugs into hybrid molecules that are promising anticancer therapeutics. These molecules are comprised of three components: a monoclonal antibody, a stable linker, and a cytotoxic small molecule drug. For the cysteine-linked ADC mimic used in this study, a dansyl fluorophore (~668 Da) is covalently bonded to an IgG1 mAb (150 kDa) via a LC-SMCC crosslinker (Figure 1). This procedure results in a mixture of drug-loaded antibody species with 0 to 8 drugs (Figure 2).
ADC conjugation plays a role in both drug efficacy as well as clearance and must be well understood during drug development.
CYSTEINE-LINKED ADC MIMIC
Figure 1
HETEROGENEITY OF CYSTEINE-CONJUGATED ADCS
Figure 2
Size exclusion chromatography (SEC) and hydrophobic interaction chromatography (HIC) are two commonly employed techniques used to characterize the drug-to-antibody ratio (DAR) under native, physiological conditions. In this application note, the ADC mimic was analyzed by size exclusion chromatography/mass spectrometry (SEC/MS) using a TSKgel® SuperSW3000 column and by HIC using a TSKgel Butyl-NPR column. Combining these chromatographic techniques allowed elucidation and verification of the DAR profile for this model biomolecule.
EXPERIMENTAL HPLC CONDITIONS
Column: TSKgel UP-SW3000 2 μm, 4.6 mm ID × 30 cm
SEC/MS CONDITIONS
Column: TSKgel SuperSW3000, 4 μm, 2 mm ID × 30 cm
Mobile phase: 100 mmol/L ammonium acetate, pH 7.0
Gradient: isocratic
Flow rate: 0.07 mL/min
Detection: ESI-MS
Temperature: 35 ºC
Injection vol.: 1.0 μL
Samples: ADC mimic, 100 µg/mL (MilliporeSigma™), 100 mmol/L ammonium acetate, pH 7.0
MS mode: Scanning, m/z 1000-8000
HIC/UV CONDITIONS
Column: TSKgel Butyl-NPR, 2.5 μm, 4.6 mm ID × 10 cm
Mobile phase: A. 50 mmol/L potassium phosphate, 1.5 mol/L ammonium sulfate, pH 7.0 plus 5% (v/v) isopropyl alcohol B. 50 mmol/L potassium phosphate, pH 7.0 plus 20% (v/v) isopropyl alcohol
Gradient: 0% B to 100% B in 50 min
Flow rate: 1.0 mL/min
Detection: UV @ 215 nm
Temperature: 35 ºC
Injection vol.: 5.0 μL
Samples: ADC mimic, 100 µg/mL (MilliporeSigma), 100 mmol/L ammonium acetate, pH 7.0
RESULTS AND DISCUSSION
The ADC mimic was injected onto a TSKgel SuperSW3000 SEC column coupled to a mass spectrometer in order to examine the DAR profile. Figure 3 shows the deconvoluted mass spectrum of the ADC mimic. Main peaks can be seen at m/z 143,799; 145,135; 146,474; 147,812; and 149,147. The difference in molecular weight between each main peak is 1336 Da, corresponding to the molecular weight of two dansyl fluorophore molecules. The average DAR was found to be 3.9.
NATIVE SEC/MS SPECTRUM OF THE ADC MIMIC
Figure 3

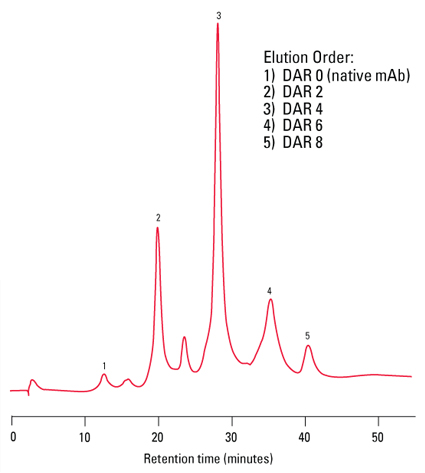
The DAR profile was then confirmed by HIC using a TSKgel Butyl-NPR column and UV detection. As more drug is conjugated to the mAb vehicle, the ADC becomes more hydrophobic and is retained longer by the HIC stationary phase, allowing resolution of the different drug loaded species. Figure 4 shows the DAR profile of the ADC mimic. The chromatogram shows well resolved peaks ranging from a DAR of 0 to 8.
HIC/UV ANALYSIS OF NATIVE ADC MIMIC
Figure 4
CONCLUSIONS
SEC/MS and HIC/UV can be effectively used to characterize the DAR profile of ADCs. The mobile phase ensured a nondenaturing, MS compatible condition that was successfully used with the TSKgel SuperSW3000 SEC column to elucidate the molecular weight of the ADC species present in the drug mimic by high resolution ESI-MS detection; SEC/MS analysis indicated that the average DAR was 3.9. HIC/UV using a TSKgel Butyl-NPR column further confirmed the DAR profile by probing the hydrophobic character of the various antibody-payload combinations present in the sample. An average DAR of 3.9 was verified via HIC/UV analysis.
DATA CONTRIBUTED BY MilliporeSigma: Cory E. Muraco1, Kevin Ray2, Gary Oden1, and Dave Bell1 1MilliporeSigma, 595 North Harrison Rd. Bellefonte, PA 168232MilliporeSigma, 2909 Laclede Ave. St. Louis, MO 63103
Nexera is a registered trademark of Shimadzu Corporation Q Exactive is a trademark of Thermo Fisher Scientific Inc.

drug conjugate mimic by SEC and HIC
TOSOH
Application n°A17L35A
Introduction
Empowered antibodies, such as antibody drug conjugates (ADCs), continue to be investigated as biotherapeutic drug candidates. ADCs combine the tumor specificity and targeting capability of mAbs with the cytotoxicity of potent small molecule drugs into hybrid molecules that are promising anticancer therapeutics. These molecules are comprised of three components: a monoclonal antibody, a stable linker, and a cytotoxic small molecule drug. For the cysteine-linked ADC mimic used in this study, a dansyl fluorophore (~668 Da) is covalently bonded to an IgG1 mAb (150 kDa) via a LC-SMCC crosslinker (Figure 1). This procedure results in a mixture of drug-loaded antibody species with 0 to 8 drugs (Figure 2).
ADC conjugation plays a role in both drug efficacy as well as clearance and must be well understood during drug development.
CYSTEINE-LINKED ADC MIMIC
Figure 1
HETEROGENEITY OF CYSTEINE-CONJUGATED ADCS
Figure 2
Size exclusion chromatography (SEC) and hydrophobic interaction chromatography (HIC) are two commonly employed techniques used to characterize the drug-to-antibody ratio (DAR) under native, physiological conditions. In this application note, the ADC mimic was analyzed by size exclusion chromatography/mass spectrometry (SEC/MS) using a TSKgel® SuperSW3000 column and by HIC using a TSKgel Butyl-NPR column. Combining these chromatographic techniques allowed elucidation and verification of the DAR profile for this model biomolecule.
EXPERIMENTAL HPLC CONDITIONS
Column: TSKgel UP-SW3000 2 μm, 4.6 mm ID × 30 cm
SEC/MS CONDITIONS
Column: TSKgel SuperSW3000, 4 μm, 2 mm ID × 30 cm
Mobile phase: 100 mmol/L ammonium acetate, pH 7.0
Gradient: isocratic
Flow rate: 0.07 mL/min
Detection: ESI-MS
Temperature: 35 ºC
Injection vol.: 1.0 μL
Samples: ADC mimic, 100 µg/mL (MilliporeSigma™), 100 mmol/L ammonium acetate, pH 7.0
MS mode: Scanning, m/z 1000-8000
HIC/UV CONDITIONS
Column: TSKgel Butyl-NPR, 2.5 μm, 4.6 mm ID × 10 cm
Mobile phase: A. 50 mmol/L potassium phosphate, 1.5 mol/L ammonium sulfate, pH 7.0 plus 5% (v/v) isopropyl alcohol B. 50 mmol/L potassium phosphate, pH 7.0 plus 20% (v/v) isopropyl alcohol
Gradient: 0% B to 100% B in 50 min
Flow rate: 1.0 mL/min
Detection: UV @ 215 nm
Temperature: 35 ºC
Injection vol.: 5.0 μL
Samples: ADC mimic, 100 µg/mL (MilliporeSigma), 100 mmol/L ammonium acetate, pH 7.0
RESULTS AND DISCUSSION
The ADC mimic was injected onto a TSKgel SuperSW3000 SEC column coupled to a mass spectrometer in order to examine the DAR profile. Figure 3 shows the deconvoluted mass spectrum of the ADC mimic. Main peaks can be seen at m/z 143,799; 145,135; 146,474; 147,812; and 149,147. The difference in molecular weight between each main peak is 1336 Da, corresponding to the molecular weight of two dansyl fluorophore molecules. The average DAR was found to be 3.9.
NATIVE SEC/MS SPECTRUM OF THE ADC MIMIC
Figure 3
The DAR profile was then confirmed by HIC using a TSKgel Butyl-NPR column and UV detection. As more drug is conjugated to the mAb vehicle, the ADC becomes more hydrophobic and is retained longer by the HIC stationary phase, allowing resolution of the different drug loaded species. Figure 4 shows the DAR profile of the ADC mimic. The chromatogram shows well resolved peaks ranging from a DAR of 0 to 8.
HIC/UV ANALYSIS OF NATIVE ADC MIMIC
Figure 4
CONCLUSIONS
SEC/MS and HIC/UV can be effectively used to characterize the DAR profile of ADCs. The mobile phase ensured a nondenaturing, MS compatible condition that was successfully used with the TSKgel SuperSW3000 SEC column to elucidate the molecular weight of the ADC species present in the drug mimic by high resolution ESI-MS detection; SEC/MS analysis indicated that the average DAR was 3.9. HIC/UV using a TSKgel Butyl-NPR column further confirmed the DAR profile by probing the hydrophobic character of the various antibody-payload combinations present in the sample. An average DAR of 3.9 was verified via HIC/UV analysis.
DATA CONTRIBUTED BY MilliporeSigma: Cory E. Muraco1, Kevin Ray2, Gary Oden1, and Dave Bell1 1MilliporeSigma, 595 North Harrison Rd. Bellefonte, PA 168232MilliporeSigma, 2909 Laclede Ave. St. Louis, MO 63103
Nexera is a registered trademark of Shimadzu Corporation Q Exactive is a trademark of Thermo Fisher Scientific Inc.
 Download_Application_a17l35a_Interchim1712.pdf
- (1.02 MiB) Downloaded 593 times